Does applying a fungicide at herbicide timing to control cereal leaf spot diseases in wheat and barley provide a yield boost?

This question comes up regularly, which makes sense. Early season outbreaks of fungal leaf spot diseases such as tan spot do occur in Manitoba, such as in 2024. But to really answer this question, we need to dig into some western Canadian research.

There have been a few studies done in Western Canada over the last 15 years investigating this very practice in both wheat and barley.

  1. The impact of fungicide and herbicide timing on foliar disease severity, and barley productivity and quality
  2. Evaluation of disease, yield and economics associated with fungicide timing in Canadian Western Red Spring wheat

In both these studies fungicide application timings were evaluated on their impact on leaf spot disease severity, overall crop yield and economic returns of the practice. In both studies, it was found that a foliar fungicide application at herbicide timing (2-3 leaf or 5 leaf) did not lower upper canopy disease incidence and severity compared to the check (no treatment or herbicide only).
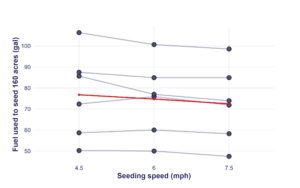
 It was also found that the foliar fungicide treatment at herbicide timing didn’t improve crop yield compared to the untreated or herbicide only check. This ultimately led to an economic loss. In both studies, researchers found that foliar fungicide application timings for cereal leaf diseases should be aimed at protecting the upper canopy and yield-contributing leaves.

There has also been some research on this topic out of North Dakota. Andrew Friskop from North Dakota State University recently compiled replicated foliar fungicide timing trial data from 2008-2024. He evaluated the yield response based on “disease risk” scenarios determined by previous crop, variety resistance, tillage, environmental conditions and disease onset.

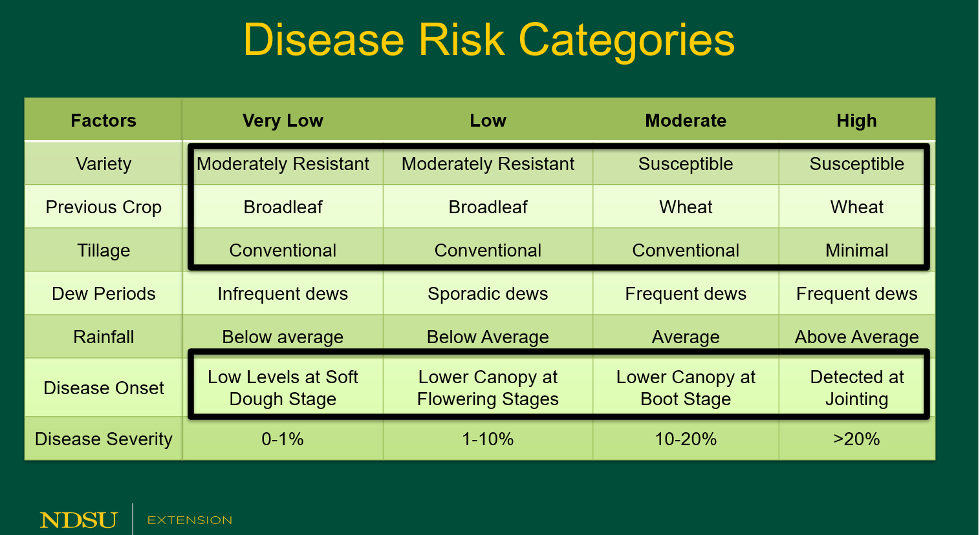
Figure 1. NDSU disease risk categories for development of residue-borne foliar diseases.

His finding suggests that under high-risk scenarios, (where wheat was grown on wheat stubble, a susceptible variety was planted and the disease [tan spot] was established early and firmly in the crop), a fungicide application at tillering could provide a small benefit of 2.2 – 3.7 bu/ac. In basically all other production scenarios he found that a foliar fungicide application at tillering would provide very little yield response.

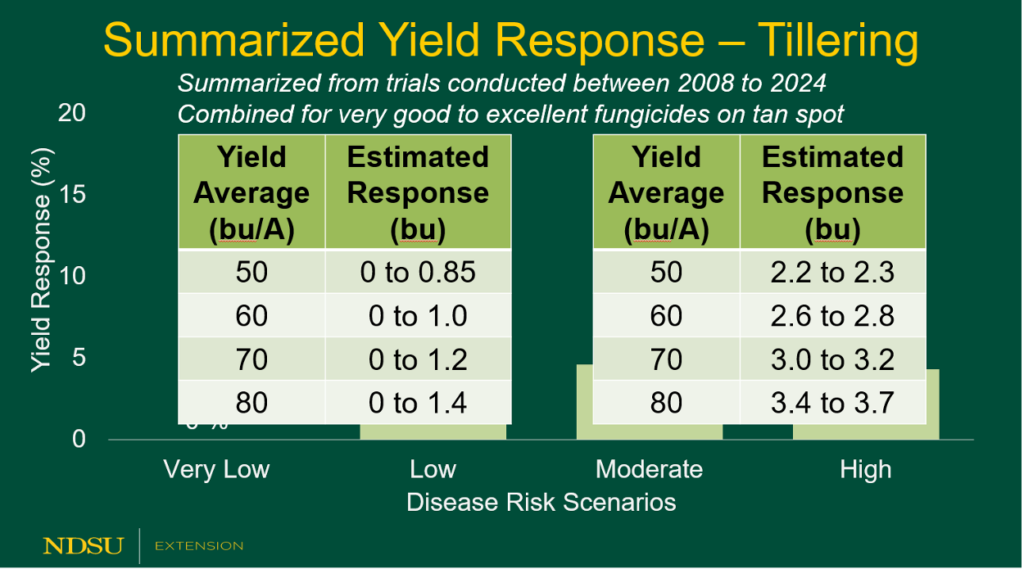
Figure 2. Summary of yield response by disease risk level for early season fungicide application.

Evaluating Wheat Seeding Speed Through the Research on the Farm Program

Faster speeds let you cover more acres per hour, but does this come at the expense of poor emergence or lower yield? How does it impact fuel use?

As a part of our Research on the Farm program, Manitoba Crop Alliance is addressing these questions by running a new trial to look at the impacts of seeding speed in spring wheat. Initial fuel use data from several trials has already been received. At most sites three seedings speeds were used: 4.5 mph, 6 mph, and 7.5 mph. Fuel use was tracked based on readouts from the tractor. Some preliminary results are already coming in. Higher speeds considerably reduce the time needed to seed a field as expected, but fuel use also appears to decrease slightly with higher speeds (Table 1).

Table 1.  Averages from six on-farm trials. Fuel costs assume diesel = $1.75/L.

Seeding speed Time needed to seed 160 acres Diesel use per 160 acres Fuel costs per 160 acres
4.5 mph 5.41 h 79.09 gal $524.34
6 mph 4.13 h 74.74 gal $495.55
7.5 mph 3.3 h 72.49 gal $480.64


Fuel usage was highly variable between trials ranging from 47 to 106 gal/160 acres, but the trend of higher speeds lowering fuel use was largely consistent (Figure 1).

Fuel use to seed 160 acres generally decreased as wheat seeding speed increased from 4.5 to 7.5 mph across multiple on-farm trial sites.

Figure 1. Fuel use at three seeding speeds across six on-farm trials. Grey lines represent individual trial sites and the red line shows the average at each speed.

Later in the growing season, plant stands, stand uniformity, and yield will be collected to assess if higher seeding speeds have any negative impact. Look out for updates on this project later this year.

I’m switching my wheat variety; do I need to change my seeding rate?

The short answer is yes; you will most likely need to change your seeding rate, but this is not just because you are planting a different wheat variety. Rather, seeding rates should be adjusted annually to reflect seed source characteristics (germination, thousand kernel weight [TKW]) and the environment the seed is being planted into, to ensure you can achieve your target plant population.  

Let’s dig into why this is. For spring wheat, provincial target plant population recommendations are between 23-28 pl/ft2, with many producers targeting the upper end of this recommendation. Achieving your target plant stands sets your crops up for success, as crop uniformity is improved, weed pressure is combatted and resources are optimized.  Seeding rates should be calculated to achieve your target plant stand, which means accounting for germination percentage, expected mortality and, importantly, your TKW. TKW changes year-to-year and from variety to variety.

Let’s consider an example to illustrate the relationship between kernel weight and seeding rate. For this example, let’s call our two varieties variety one and variety two. When comparing these two varieties we need to consider:

  • TKW: The weight (g) of 1,000 kernels of wheat from a specific seed lot.
  • Germination: If using bin-run seed, a seed test is needed to determine germination percentage. If purchasing certified seed, then your seed provider will be able to provide you with this information.
  • Expected mortality: The percent of seed/seedlings that won’t produce a plant due to unfavourable conditions or biotic stress.
  • Expected seed survival: Germination – Expected Mortality.

Example #1:

Variety

TKW

Germ (%)

Expected mortality (%)

Expected seed survival

Target plant density (pl/ft2)

1

42

97

6

91

27

2

33

97

6

91

27

Using the formula provided by Manitoba Agriculture (below) we can see the difference in seeding rates and therefore seed costs.

Seeding by plant population formula:

Seeding rate (lb/ac) = Target Plant Population (pl/ft2) x TKW (g)

                                              Expected Seed Survival (decimal) x 10

 Variety 1:

Seeding rate (lb/ac) = Target Plant Population (pl/ft2) x TKW (g)

                                              Expected Seed Survival (decimal) x 10                                          

                                                         = 27 (pl/ft2) x 42 (g)

                                                                     0.91 x 10

                                                         = 125 lb/ac

Variety 2:

Seeding rate (lb/ac) = Target Plant Population (pl/ft2) x TKW (g)

                                              Expected Seed Survival (decimal)

                                                         = 27 (pl/ft2) x 34 (g)

                                                                     0.91 x 10

                                                          = 101 lb/ac

This example shows that there is roughly a 24 lb/ac difference between the two seeding rates to achieve the same desired plant population. If you seeded variety 2 at the same rate as variety 1, then you would have over seeded, which could result in a thicker canopy, bringing challenges like an increased lodging and disease development risk.

Also, over seeding would have cost you money. Using a standard seed cost of 0.27 ¢/lb of seed (Manitoba Cost of Production Guide), then variety 2 at your normal rate would cost an additional $6.5/ac of seed that is probably not needed to reach your desired plant population.

Now, if the weather, disease, insects and equipment co-operate, you’ll achieve your target plant population. But it’s always best practice to do plant counts to get an understanding of the crop establishment and uniformity of emergence. More information on plant stand counts can be found here: Plant Stand Counts in Spring Cereals | Manitoba Crop Alliance.

Top