When does spring wheat reach physiological maturity and when is the proper timing for pre-harvest glyphosate application?

By Andrew Hector, Agronomy Extension Specialist – Cereal Crops, Manitoba Crop Alliance

Properly identifying spring wheat growth stages is important throughout the season, but growth stage identification becomes essential as we near plant maturity and approach the window for pre-harvest activities such as swathing or applying pre-harvest glyphosate.

What is physiological maturity (PM)?

At PM, wheat plants have accumulated the maximum amount of kernel dry weight. Therefore, at this point, final maximum yield has been determined, and no more dry matter is being accumulated in the kernels.

How to identify PM

When assessing growth stage, check representative areas of the field. Special attention should be given to the least mature part of the field, especially if you are applying a pre-harvest weed control product, to avoid maximum residue limit (MRL) issues.

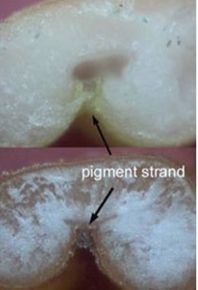
The first indication of PM is the loss of green colour from the kernels,= and the appearance of dark pigment along the kernel crease (Figure 1). It’s important to note that kernels on the same head don’t mature simultaneously, with the middle kernels maturing first.

Figure 1. Wheat kernels prior to (top) and at (bottom) physiological maturity (note the darkened pigment strand).

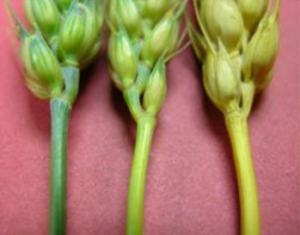
The second indication of PM is when the peduncle (i.e., stem below the wheat head) changes from dark green to light green or yellow. Once the peduncle turns yellow, the plant is getting close to PM. However, change in peduncle colour is just an indicator (Figure 2). A fingernail test is also required to confirm growth stage.

Figure 2. Peduncle colour change associated with physiological maturity.

Pre-harvest glyphosate application for perennial weed control

Glyphosate is registered for pre-harvest weed control only, it is not a desiccant. Proper application timing can be challenging, especially if crop maturity is uneven across the field. Ensure the least mature part of the field is assessed for appropriate crop staging, to reduce MRL issues.

If applying, application should be conducted when grain moisture content (MC) is below 30 per cent, AKA the hard dough stage. Application prior to 30 per cent MC can reduce grain yield and quality. Furthermore, early application can lead to elevated residues in grain.

Conduct a thumbnail test:

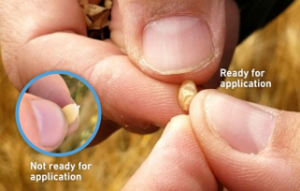
  • Shell out the wheat head. Press your thumbnail into the kernel. At < 30 per cent kernel MC, and under reasonable pressure, the thumbnail impression or dent will remain. This indicates that plant has reach hard dough (Figures 3 & 4).
  • If the imprint of dent does not remain in the kernel, then the plant is not at the appropriate stage for a pre-harvest glyphosate application.

Always read and follow label directions. Check with your grain buyer before applying a pre-harvest product to ensure grain acceptance.

Figure 3. Thumbnail test assessing kernel moisture. Source: Keep it Clean.

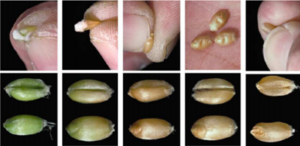
Figure 4. Kernels at various times during grain filling: a. watery ripe, b. late milk, c. soft dough, d. hard dough (loss of green colour) and e. ripe for harvest. Source: Dave Hansen, Growth and Development Guide for Spring Wheat.

Additional Resources

I’m switching my wheat variety; do I need to change my seeding rate?

The short answer is yes; you will most likely need to change your seeding rate, but this is not just because you are planting a different wheat variety. Rather, seeding rates should be adjusted annually to reflect seed source characteristics (germination, thousand kernel weight [TKW]) and the environment the seed is being planted into, to ensure you can achieve your target plant population.  

Let’s dig into why this is. For spring wheat, provincial target plant population recommendations are between 23-28 pl/ft2, with many producers targeting the upper end of this recommendation. Achieving your target plant stands sets your crops up for success, as crop uniformity is improved, weed pressure is combatted and resources are optimized.  Seeding rates should be calculated to achieve your target plant stand, which means accounting for germination percentage, expected mortality and, importantly, your TKW. TKW changes year-to-year and from variety to variety.

Let’s consider an example to illustrate the relationship between kernel weight and seeding rate. For this example, let’s call our two varieties variety one and variety two. When comparing these two varieties we need to consider:

  • TKW: The weight (g) of 1,000 kernels of wheat from a specific seed lot.
  • Germination: If using bin-run seed, a seed test is needed to determine germination percentage. If purchasing certified seed, then your seed provider will be able to provide you with this information.
  • Expected mortality: The percent of seed/seedlings that won’t produce a plant due to unfavourable conditions or biotic stress.
  • Expected seed survival: Germination – Expected Mortality.

Example #1:

Variety

TKW

Germ (%)

Expected mortality (%)

Expected seed survival

Target plant density (pl/ft2)

1

42

97

6

91

27

2

33

97

6

91

27

Using the formula provided by Manitoba Agriculture (below) we can see the difference in seeding rates and therefore seed costs.

Seeding by plant population formula:

Seeding rate (lb/ac) = Target Plant Population (pl/ft2) x TKW (g)

                                              Expected Seed Survival (decimal) x 10

 Variety 1:

Seeding rate (lb/ac) = Target Plant Population (pl/ft2) x TKW (g)

                                              Expected Seed Survival (decimal) x 10                                          

                                                         = 27 (pl/ft2) x 42 (g)

                                                                     0.91 x 10

                                                         = 125 lb/ac

Variety 2:

Seeding rate (lb/ac) = Target Plant Population (pl/ft2) x TKW (g)

                                              Expected Seed Survival (decimal)

                                                         = 27 (pl/ft2) x 34 (g)

                                                                     0.91 x 10

                                                          = 101 lb/ac

This example shows that there is roughly a 24 lb/ac difference between the two seeding rates to achieve the same desired plant population. If you seeded variety 2 at the same rate as variety 1, then you would have over seeded, which could result in a thicker canopy, bringing challenges like an increased lodging and disease development risk.

Also, over seeding would have cost you money. Using a standard seed cost of 0.27 ¢/lb of seed (Manitoba Cost of Production Guide), then variety 2 at your normal rate would cost an additional $6.5/ac of seed that is probably not needed to reach your desired plant population.

Now, if the weather, disease, insects and equipment co-operate, you’ll achieve your target plant population. But it’s always best practice to do plant counts to get an understanding of the crop establishment and uniformity of emergence. More information on plant stand counts can be found here: Plant Stand Counts in Spring Cereals | Manitoba Crop Alliance.

Top