Section Title
Wheat and barley crop water use
- Wheat
Water demand differs by crop type. Understanding crop water requirements can be beneficial when building rotations, making fertilizer rate decisions, and making crop and landscape management choices.
Cereal crop water demand
Cereal crops differ slightly in their water demands. Spring wheat for instance needs approximately four inches of available moisture to complete its life cycle and produce a bushel of grain (Manitoba Agriculture, n.d.). The rule of thumb is that every additional inch of available moisture produces another four to five bushels of grain. This number is slightly higher for barley (Government of Alberta, 2011). Therefore, available soil moisture and long-term precipitation data can help guide target yields and management decision.
It’s important to note that crop water needs change throughout the growing season. The water needs of spring wheat, barley, and winter wheat follow a similar shape to a bell curve during the months of May – September (Figure 1), with crop water demands smallest at the beginning and end of the plant’s life cycle. Although crop demand is small at seeding, it is still vitally important. As cereals grow and leaf area increases, so does evapotranspiration, and crop water demand. Daily water demand for spring wheat reaches a maximum during heading and flowering, with demand peaking at approximately seven millimetres of water a day (Government of Alberta, 2011). Refer to Figure 1, below, for more information on daily water use at each growth stage for spring wheat, barley, and winter wheat.
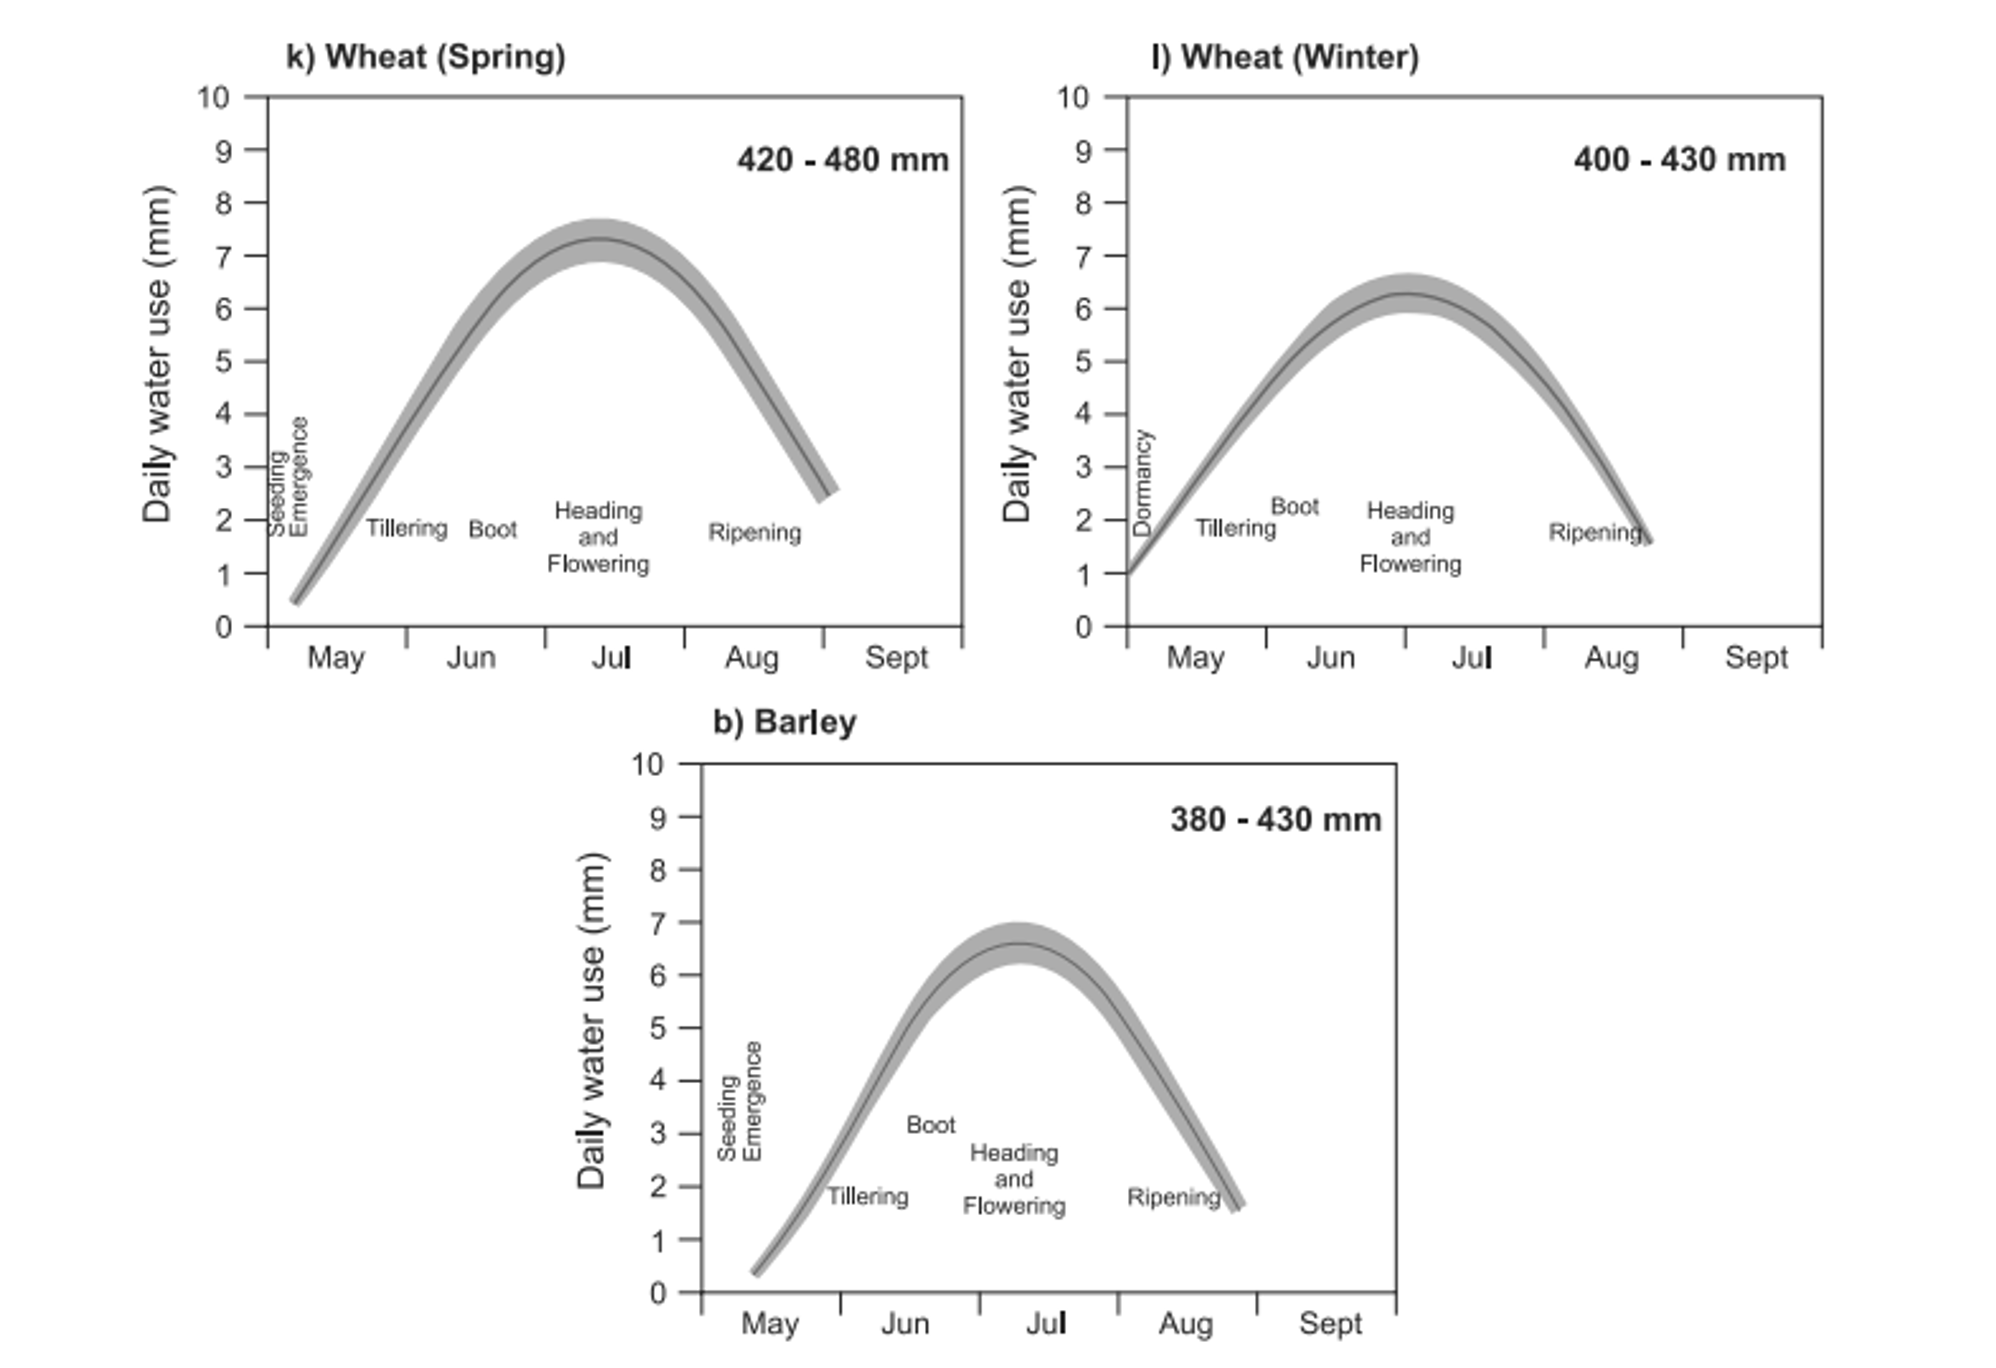
Figure 1. Crop daily water demands for spring wheat (top left), barley (bottom), and winter wheat (top right) throughout the growing season (Government of Alberta, 2011).
Furthermore, water stress and overall environmental stress can have a large impact on wheat yield. Campbell et al. (1981) found that moisture stress during booting to grain development negatively impacted grain yield the most severely. Moisture stress earlier in the growing season also impacted grain yield, but not to the same extent as during the other growth stages (Campbell et al. 1981). Yield reductions are a consequence of the effects of environmental stress on the primary yield components of cereal grains. The primary yield components are number of heads per acre, number of kernels per head, and weight per kernel. Below, Table 1 outlines how drought and environmental stress will impact wheat yield components at different growth stages.
Table 1. The effect environmental stresses have on cereal crop yield components at various growth stages (Manitoba Agriculture, n.d.).
| Growth Stage | Yield Component |
| Emergence and Tillering | Tillers per plant |
| Late tillering to early flowering | Spike survival per plant |
| Stem elongation to boot | Number of spikelets per spike |
| Mid stem elongation to early dough | Number of kernels per spike |
| Milk to maturity | Kernel size |
Similarly to drought conditions, excess moisture can be detrimental to plant growth. When examining annual cereal crops, spring wheat is more tolerant to saturated soil conditions compared to barley, and the opposite is the case for drought tolerance. This is probably due to barley’s response or tolerance of ethylene which can accumulate in the saturated soil poor space (Manitoba Agriculture, n.d.). As well, preliminary results from an experiment at the Arborg Diversification Centre (PESAI) found that flooding at early and late growth stages in 2019 and 2020 caused significant yield loss compared to the control in spring wheat. Flooding at early growth stages caused the most severe yield loss (PESAI, 2021). Furthermore, a study by Borrego-Benjumea et al. (2019) found that excessive moisture in May and June caused yield loss in Barley.
Soil water stores
Entering each new growing season there are many considerations, including determining your target yield. Past field history and lived knowledge is one method and probably the most used to determine yield goals (Manitoba Agriculture, 2007). Using soil moisture and expected precipitation throughout the growing season is another method used to determine target yields, and thus, drive management decisions, specifically nutrient recommendations. This method is usually more important when moisture is the limiting growth factor (Manitoba Agriculture, 2007). The trouble is that expected rainfall throughout the growing season is difficult to predict, so long-term growing season precipitation averages and lived experience should be used to make these predictions. More information on how soil moisture levels can influence management decisions can be found here. Overall, growing season precipitation usually accounts for two-thirds of wheat crop water demand. However, soil moisture stores still provide crops with moisture, and this can be evaluated. Fall soil moisture maps are a good starting point when evaluating soil moisture stores. Maps are created by Manitoba Agriculture, using their network of weather stations to take soil moisture measurements down to 120 cm.
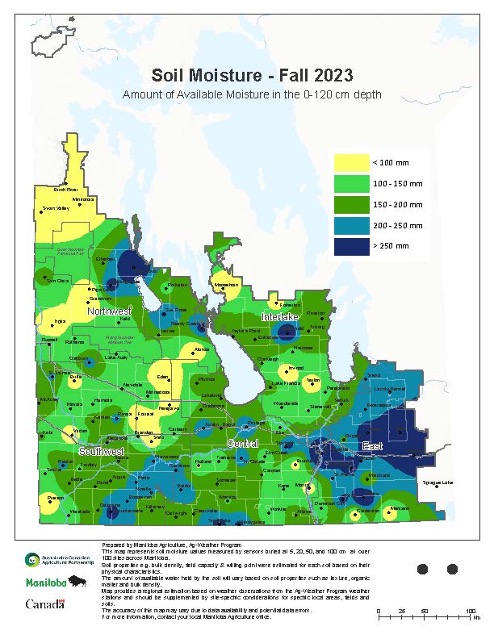
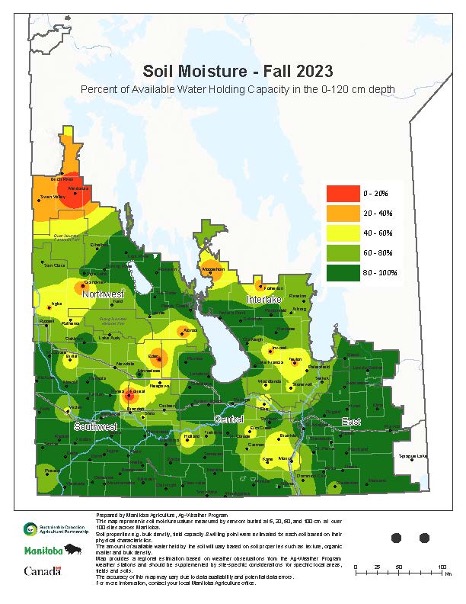
Figure 2. Fall 2023 available soil moisture (left) and percent of available soil moisture (right) maps for Agro-Manitoba to a depth of 120 cm (Manitoba Agriculture, 2023).
These maps in Figure 2 give a coarse description of the available fall soil moisture, but determining field specific soil moisture conditions can assist in guiding preliminary management decision. The “feel and appearance” or “brown soil moisture probe” methods can be used to do this, the description of both methods can be found here. As well, a step-by-step example produced by the Canola Council of Canada on how to use the “Brown soil probe” can be found here. Soil texture heavily influences the amount of water available to the plant, soil water holding capacity and its drainage. Once fall soil moisture content is accounted for, then estimates of total available growing season moisture can be estimated.
Moisture management considerations
There are multiple management practices that can be implemented to influence soil moisture levels, whether you are trying to manage excess moisture or drought conditions. Listed below are brief descriptions of some management practices that affect soil moisture, but more in-depth information can be found here.
Rotations – Rotations can significantly impact soil moisture levels. A four-year experiment in a semi-arid environment from Agriculture and Agrifood Canada, at the Swift Current Research and Development Center found that soil moisture levels significantly changed as crop rotation changed. For example, the inclusion of shallow rooted crops, such as peas or lentils into a wheat cropping system resulted in increased water content in the 60-90 cm depth of the profile, which can be reached by deeper rooted crops, like wheat, potentially increasing yield (Niu et al., 2017).
Tillage – For every tillage pass approximately ½ - 1 inch of water is lost, thus, reduced, no-till and minimum till have been found to increase soil moisture levels (Manitoba Agriculture, 2008). In areas where there are usually moisture deficits or a soil type that has limited water holding capacity, direct or conservation tillage should be considered. Also, soil organic matter levels are influenced by tillage, which in turn affects soil moisture levels.
Stubble – Standing stubble has a positive influence on soil moisture. Standing stubble aids in the capture of snow and reduces evaporation, increasing soil water stores.
Drainage – Waterlogged soils are detrimental to plant growth; thus, it is necessary to remove excess water to improve overall crop production and reduce annual yield variability (Manitoba Agriculture, 2008). Furthermore, excess water can reduce accessibility to fields. The two main types of drainage are surface drainage and tile drainage, also known as subsurface drainage. More information regarding drainage can be found here.
References
- Borrego-Benjumea, A., Carter, A., Glenn, AJ., & Badea, A. (2019). Impact of excess moisture due to precipitation on barley grain yield in the Canadian Prairies. Canadian Journal of Plant Science, 99 (1), 93-96. http://dx.doi.org/10.1139/cjps-2018-0108
- Campell CA., Davidson HR., & Winkleman GE. (1981). Effect of nitrogen, temperature, growth stage and duration of moisture stress on yield components and protein content of Manitou spring wheat. Canadian Journal of Plant Science, 61 (3), 549-563.
- Government of Alberta. (2011, n.d.) Crop Water Use and Requirements. Government of Alberta. 5485851-2011-agri-facts-crop-water-use-requirements-revised-100-561-1-2011-11.pdf (alberta.ca)
- Manitoba Agriculture. (2023, n.d.). Manitoba Fall Soil Moisture Survey. Government of Manitoba. Province of Manitoba | agriculture - Manitoba Fall Soil Moisture Survey (gov.mb.ca)
- Manitoba Agriculture. (n.d.). Moisture and Target Yields. Government of Manitoba. Province of Manitoba | agriculture - Moisture and Target Yields (gov.mb.ca)
- Manitoba Agriculture. (2007, n.d.). Manitoba Soil Fertility Guide. Government of Manitoba. soil_fertility_guide.pdf (gov.mb.ca)
- Manitoba Agriculture. (2008, n.d.). Soil Management Guide. Government of Manitoba. untitled (gov.mb.ca)
- Manitoba Agriculture. (n.d.). Managing Crops for Excess Water Stress. Government of Manitoba. Province of Manitoba | agriculture - Managing Crops for Excess Water Stress (gov.mb.ca)
- Manitoba Agriculture. (n.d.). How do warm and dry conditions affect wheat and corn development. Government of Manitoba. wheat-corn-development-warm-dry-conditions.pdf (gov.mb.ca)
- Niu, Y., Bainard L.D., Hamel, C., & Gan, Y. (2017). Soil residual water and nutrients explain about 30% of the rotational effect in 4-yr pulse-intensified rotation system. Canadian Journal of Plant Science, 97 (5), 852 – 864. dx.doi.org/10.1139/cjps-2016-0282
- Prairies East Sustainable Agriculture Initiative Inc. (2021). Excess moisture effects on the growth & yield of spring wheat. Manitoba Diversification Centers. Excess-moisture-Wheat-2020.pdf (mbdiversificationcentres.ca)

-
April 7, 2026
Fungal leaf diseases can be major yield robbers in wheat crops across Manitoba. Leaf diseases reduce plant health and photosynthetic… Read More
-
December 16, 2025
Although not the most prominent cereal diseases, seedling blight and root rot diseases do impact yield in small grains. These… Read More
-
December 3, 2025
THE CANADIAN MALTING BARLEY TECHNICAL CENTRE (CMBTC) RECOMMENDED LIST provides producers with an indication of which malting barley varieties have… Read More

-
September 8, 2025
Lodging is one of the most common issues across the Prairies. Growers can use tools such as PGRs or select… Read More
-
July 3, 2025
Identifying the structure and function of wheat head parts is important for making management decisions, describing insect and diseases issues,… Read More
-
April 25, 2025
Do you know where your wheat yield comes from? Understanding wheat yield components and how management choices influence each component… Read More
-
November 8, 2024
Rapid visco analysis (RVA) is the assessment used to determine the degree of pre-germination in barley grain. This measurement is… Read More
-
October 21, 2024
This document is designed as a guide for use in proactively scouting wheat fields to detect pests at or before… Read More

-
August 9, 2024
Manitoba growers know the devastating impacts of hail on wheat due to unstable spring and summer weather. Assessing hail damage… Read More