Section Title
Newly Developed Prairie-Wide Fusarium Head Blight (FHB) Risk Maps
- Wheat
- Winter Wheat
Why the Fuss About Fuzz?
Fusarium head blight (FHB) is a serious fungal disease that mainly affects wheat (including durum), barley, oats and corn. FHB causes economic losses in three ways: 1) yield losses; 2) downgrading of grains; and 3) mycotoxin contaminations reducing grain marketing options. FHB has become increasingly prevalent in the Prairie provinces, calling for awareness and judicious management. One key FHB management practice as part of an integrated management approach is timely fungicide application when the risks are high. Risk maps are an important tool to assess FHB risks and make fungicide decisions. Starting in 2024, a unified prairie-wide FHB risk map for spring wheat, durum wheat, winter wheat and barley was introduced.
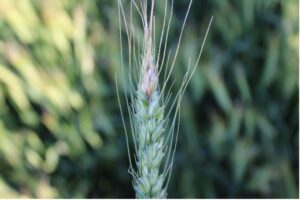
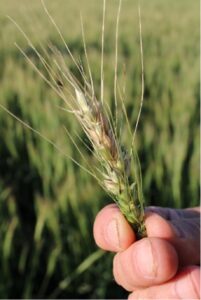
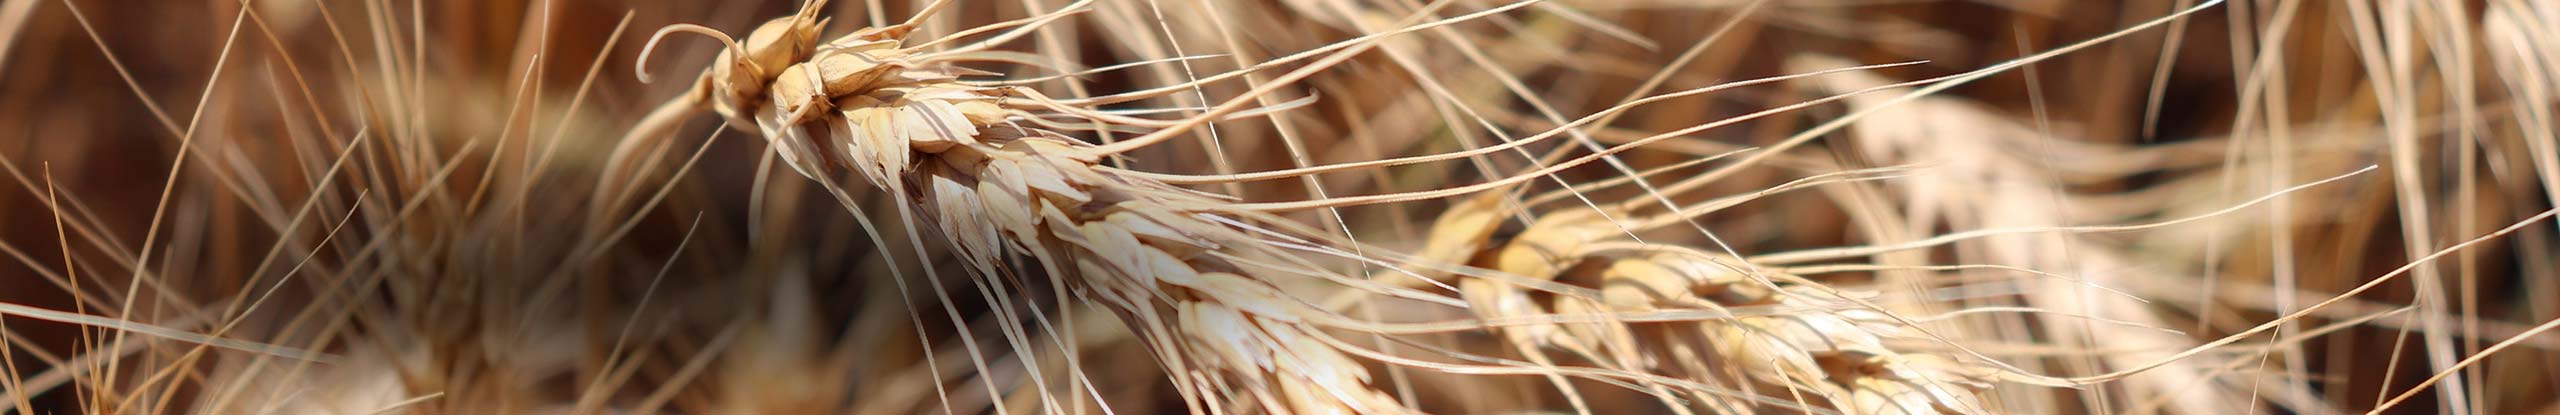
Figure 1: Wheat Head with Fusarium head blight (photo credit: Manitoba Crop Alliance).
For more information on FHB, check out these resources:
- Fusarium Head Blight | Disease | Government of Saskatchewan
- Province of Manitoba | agriculture - Dealing with Fusarium Head Blight (gov.mb.ca)
- Fusarium head blight – Overview | Alberta.ca
Prairie-wide Fusarium Head Blight Risk Maps: Background
Prior to 2024, all three Canadian Prairie provinces created individual FHB risk maps that were adopted from U.S.-developed models that have been modified for the Canadian Prairies. The FHB risk maps are available during cereal flowering period, usually from early June until late July. However, due to the differences between the models used in each province, the past maps could show different risk levels. This was especially an issue for producers along provincial borders, who could receive different risk levels depending on which provincial map they viewed.
To address this issue, new prairie-wide models were developed to improve the provincial FHB risk maps. The new models were developed for spring wheat, winter wheat, barley, and durum. The new models feature higher accuracy than the existing models and multiple ways to demonstrate FHB risks:
- FHB index (FHBi)
- Fusarium damaged kernel (FDK)
- Deoxynivalenol (DON)
Note: Not all risk factors are currently available for all crops. See the last section for details.
Where Can You Find the Maps?
To view the interactive prairie-wide risk maps, a new site prairiefhb.ca is now available. Users looking for the maps will be guided to the new website instead of viewing the traditional standalone maps. From May 15 – Aug. 31, the site uses over 500 weather stations across the Prairies to generate the FHB risk maps.
The platform works on all devices that can connect to the internet and the displayed map can be downloaded to the device either as a pdf or an image file.
How to Use the Website
The steps listed below correspond to the numbers displayed in Figure 2:
- Select the date of interest. The map is available up to the current date and runs from May 15 – Aug. 31 each year.
- Choose the crop type from the four crops: winter wheat, spring wheat, barley and durum.
- Select the variety to be analyzed from the dropdown arrow.
- Choose the type of risk from the three options. Some crop types do not have all three risk options.
- Click “Show Results” to view the risk map.
- Click on the Risk Legend to view the risk level that corresponds to each colour.
- Click on the hamburger icon to view the location of the weather stations.
- Click on the Export button to download the map view along with the selected date, crop and variety.
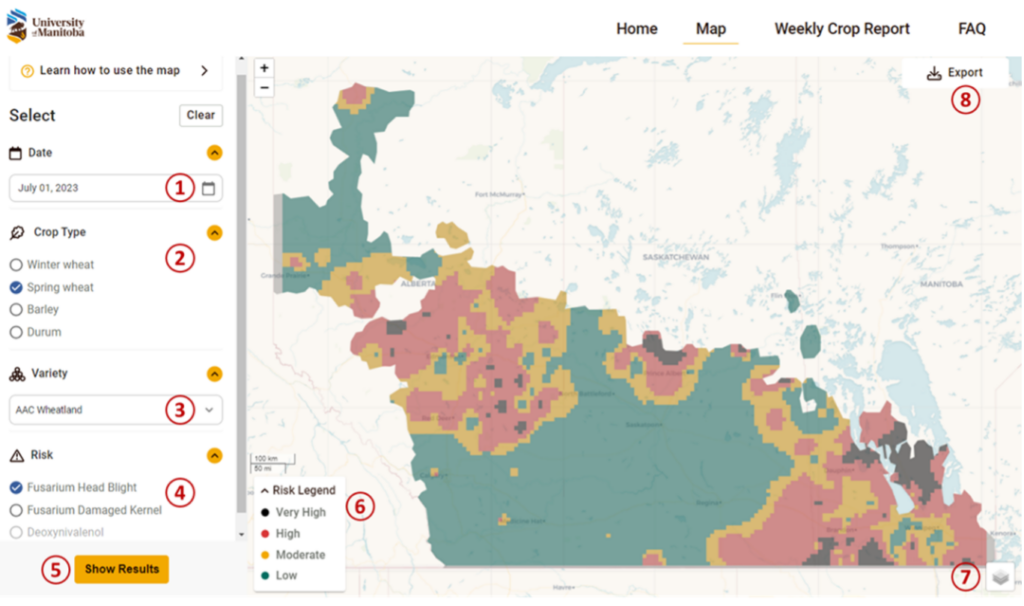
Figure 2. Screenshot of the new FHB interactive tool.
Understanding the Map: What is FHB-Index, FDK and DON?
The prairie-wide FHB risk maps use FHB index (FHBi), Fusarium-damaged kernels (FDK) and Deoxynivalenol (DON) to demonstrate FHB risks.
FHBi is the prevalence of the disease as measured in the field during the grain filling stage of crop development. It is the average percentage of infected kernels per infected head multiplied by the average percentage of infected heads in the field.
For example, if one in four heads are showing symptoms and an average of 10 per cent of the head is infected, FHB index is calculated as: FHBi = (25 x 10)/100 = 2.5. Fields with FHBi of 10 or greater are considered high. (Source: https://extension.missouri.edu/publications/g4351#:~:text=For%20example%2C%20if%2025%25%20of,or%20greater%20is%20considered%20high.)
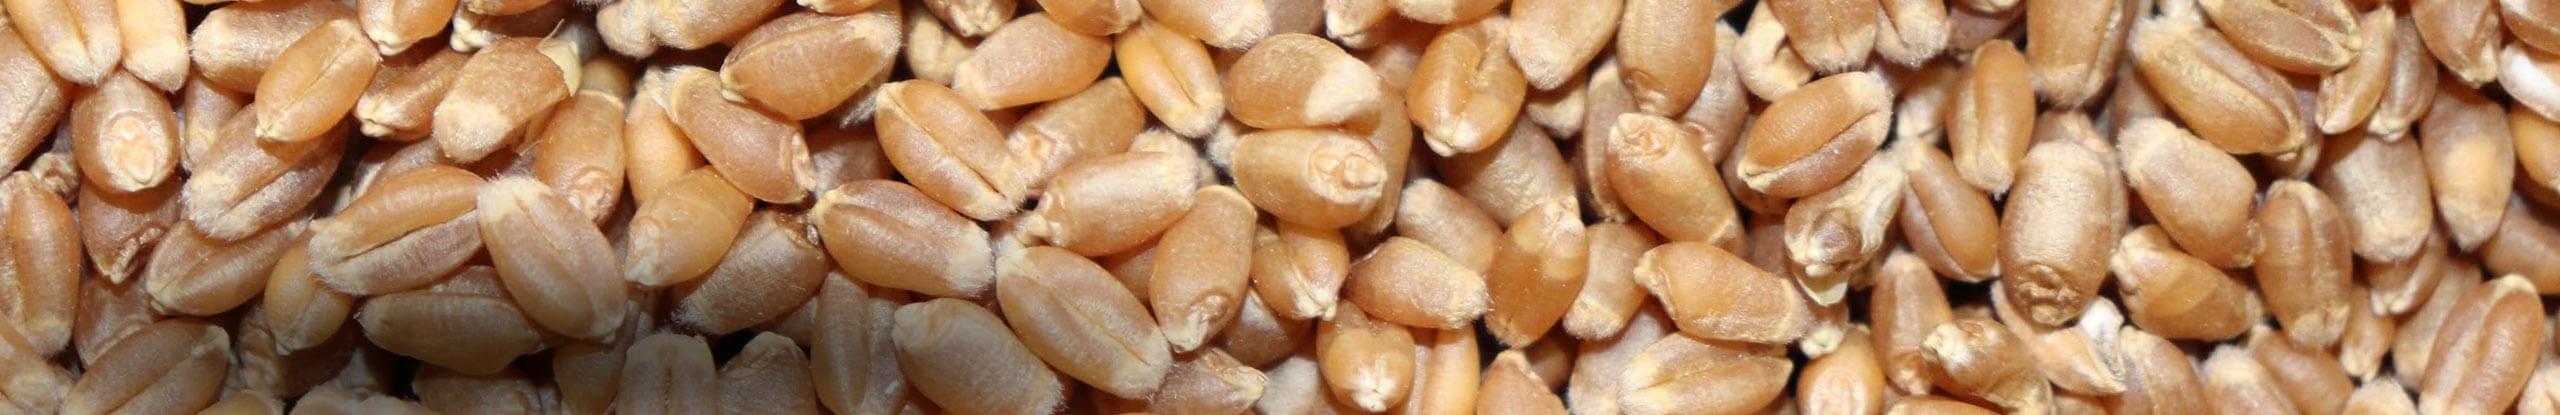
FDK result from FHB infection in cereals and cause grain that is shrivelled and lightweight. It is a grading factor in cereal crops and is reported as the percentage of Fusarium-damaged kernels in a grain sample. More information on grading factors can be found here.
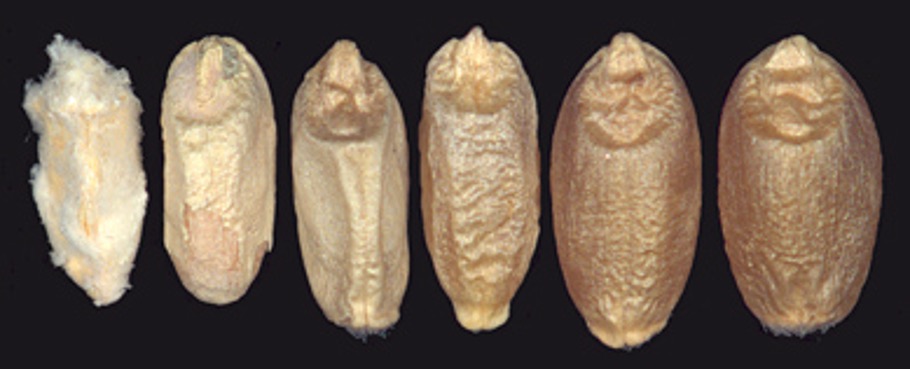
Figure 3. Fusarium-damaged kernels in wheat. Source: Canadian Grain Commission
DON, commonly referred to as vomitoxin, is a common mycotoxin produced in FHB-infected cereals. It is often measured using the enzyme-linked immunosorbent assay (ELISA) method to determine the amount (in parts per million) that is present in a grain sample. The maximum level allowed in uncleaned soft wheat in Canada is 2 ppm. (Source: https://www.canada.ca/en/health-canada/services/food-nutrition/food-safety/chemical-contaminants/maximum-levels-chemical-contaminants-foods.html)
How do Farmers use FHB Risk Maps?
For farmers, this new FHB risk map tool helps them assess the FHB risk levels in their area and assist in disease management decisions. Farmers should always scout their fields to determine if all aspects of the disease triangle are met. The three requirements for a disease to exist are a virulent pathogen, a susceptible host, and favourable environmental conditions. The risk maps only give an indication if environmental conditions favour disease development, the maps do not provide information on the two other aspects of the disease triangle. The new FHB map and models need to be used in tandem with traditional scouting to determine FHB risk for individual fields, specifically to determine if environmental conditions match host crop susceptibility timing.
Here are a few examples of how to interpret FHB maps with respect to crop staging. If environmental conditions result in a high FHB risk but your wheat crop is not at a susceptible growth stage, then the overall risk would be low. Although the risk is low the crop should be scouted regularly to monitor growth stages and FHB risk. Another example, if most barley heads on the main stem have fully emerged (headed) and the FHB risk maps indicate high risk for infection, then your overall risk level would be high and fungicide application would be recommended. This information, plus discussions with your local agronomist or extension agent can help guide fungicide application decisions for FHB suppression.
Generally, small cereal grains can be infected by FHB from heading to soft dough stage. Wheat is most susceptible to infection during flowering while barley is most susceptible immediately following head emergence.
Data Supporting the Fusarium Head Blight Risk Maps
Data for the new models came from 1,800 plots (40 plots x five study sites x three provinces x three years). The study tested 80 combinations of hourly weather variables including rainfall, relative humidity, air temperature and solar radiation to determine those most highly correlated to the disease. Disease levels were determined from field observations for FHBi and from laboratory analysis for FDK and DON. The study developed FHBi risk models for all four crops, FDK risk models for spring wheat and durum, and a DON risk model for durum. The new models were developed in Western Canada and tested with an independent dataset collected from more than 300 producer fields on the Prairies. The large dataset and validation method ensure the accuracy of the new models. Additional study is underway to gather more data points for developing models for the risk parameters of the other crops and to further increase the accuracy of the developed models.
A prairie-wide FHB project led by Dr. Paul Bullock at the University of Manitoba, in partnership with provincial agriculture ministries, developed new models and in turn, a new mapping platform for use in Western Canada. The project was funded from 2018 to 2023 through the Integrated Crop Agronomy Cluster of the Canadian Agricultural Partnership with partners from Agriculture and Agri-Food Canada, Brewing and Malting Barley Research Institute, Sask Wheat, Western Grains Research Foundation, Alberta Grains, Manitoba Crop Alliance (MCA) and Prairie Oat Growers Association.
Ongoing research and development of the online risk mapping tool is being led by the University of Manitoba in partnership with the Prairie cereal commodity associations (Alberta Grains, Sask Wheat, Sask Barley and MCA) and provincial governments (Governments of Alberta, Saskatchewan, and Manitoba).
-
April 7, 2026
Fungal leaf diseases can be major yield robbers in wheat crops across Manitoba. Leaf diseases reduce plant health and photosynthetic… Read More
-
December 16, 2025
Although not the most prominent cereal diseases, seedling blight and root rot diseases do impact yield in small grains. These… Read More
-
December 3, 2025
THE CANADIAN MALTING BARLEY TECHNICAL CENTRE (CMBTC) RECOMMENDED LIST provides producers with an indication of which malting barley varieties have… Read More
-
September 8, 2025
Lodging is one of the most common issues across the Prairies. Growers can use tools such as PGRs or select… Read More
-
July 3, 2025
Identifying the structure and function of wheat head parts is important for making management decisions, describing insect and diseases issues,… Read More
-
April 25, 2025
Do you know where your wheat yield comes from? Understanding wheat yield components and how management choices influence each component… Read More
-
November 8, 2024
Rapid visco analysis (RVA) is the assessment used to determine the degree of pre-germination in barley grain. This measurement is… Read More
-
October 21, 2024
This document is designed as a guide for use in proactively scouting wheat fields to detect pests at or before… Read More
-
August 9, 2024
Manitoba growers know the devastating impacts of hail on wheat due to unstable spring and summer weather. Assessing hail damage… Read More