Blog: Agronomy & Extension

Estimating Yield in Grain Corn

Estimating grain corn yield in any given field is exactly that – an estimate. The more samples and counts that are taken, the better variations in the field will be captured and accounted for. However, on that same note, no matter how many counts are done in a field, a variance of 20 bushels of yield (plus or minus) is a reasonable expectation.

A STEP-BY-STEP PROCESS FOR GRAIN CORN YIELD ESTIMATION:

1. Prior to sampling, determine how many samples or counts will be taken in each field. A minimum of 5 is recommended, 5 – 10 being appropriate. Of course, the more counts that are taken, the better representation of the field, overall.

  • Tools needed: measuring tape, pen and paper. A calculator can be used in the field, or once all samples are completed, but will be required.

2. Enter the field and walk in several paces beyond the headlands. Pick a representative location to take the first count.

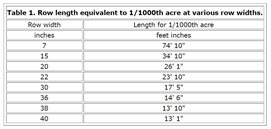
3. Measure a single row to the appropriate length of 1/1,000th of an acre. For the most common 30” row spacing, 17’5” is the appropriate length.

1 1000th acre

Figure 1: Row length required to measure 1/1,000th acre in various row widths

4. In the chosen 1/1,000th acre, count and record the number of harvestable ears on the plants. Do not count ears that have either dropped or may be on lodged plants and will not be picked up by the combine header.

5. Choose every 5th – 6th ear in the row and record the number of kernel rows and average kernels per row, and multiply the two factors for each chosen ear.

  • Be sure to be selecting representative ears.
  • Kernel rows are typically 12 – 18, but can be fewer or greater than that.
  • Kernels per row – do not count aborted kernels; do not count the extreme base or tip kernels.

6. Add all counts together for the first site, then divide by number of sampled ears. For example, if 5 ears were sampled with kernel counts of 336, 384, 512, 496 and 600, the average number of kernels per ear: (350 + 380 + 510 + 500 + 625)/5 = 473

7. Yield for each sample site in one field is determined by multiplying ear number (Step 4) by the average number of kernels per ear (Step 6) and then dividing that total by 90. 90 represents the average number of kernels in a bushel of corn at 15.5% moisture (90,000). In a scenario where grain fill has exceptionally good, decrease that value to 80, and conversely, increase that number to 100 if grain fill has been particularly stressful and grain is lightweight.

Yield equation

Figure 2: Grain corn yield estimate formula – Iowa State University (https://crops.extension.iastate.edu/cropnews/2017/08/estimating-corn-yields-using-yield-components)

Formula example for sample site #1:

Let’s say 31 harvestable ears were counted at the first sample site.

  • (31 harvestable ears * 473 kernels per ear)/90 = 163 bushels per acre for average/normal grain fill.
  • (31 harvestable ears * 473 kernels per ear)/80 = 183 bushels per acre for exceptional grain fill.
  • (31 harvestable ears * 473 kernels per ear)/100 = 147 bushels per acre for a below average grain fill.

Repeat this procedure 5 – 10 times throughout the field to get a good representative estimate and average the number of sites to yield calculations. Let’s say 7 sample sites were calculated:

(163 bu. + 182 bu. + 155 bu. + 159 bu. + 171 bu. + 176 bu. + 164 bu.)/ 7 sample sites = 167 bu/acre yield estimate for this grain corn field sampled.

REFERENCES:

Estimating Corn Grain Yield Prior to Harvest

Estimating Grain Corn Yield

Estimating Corn Yields Using Yield Components

Common Preharvest Questions in Flax

What is the staging for a preharvest or desiccation in flax?

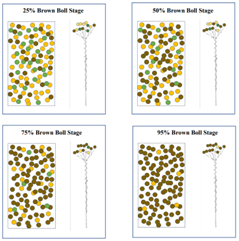
Flax is considered physiologically mature when 75% of the bolls (in the field or on a plant) are brown and the boll segments have begun to separate. This is a visual rating that corresponds to a grain moisture content of around 30% and is known as the 75% boll turn or 75% brown boll stage.

Flax Maturity Ratings Sask Flax

Figure 1: Flax Maturity Ratings. Credit: SaskFlax

What is the difference between a preharvest aid and a desiccant?

Two types of chemicals are available to assist with flax harvest management: pre-harvest herbicides (sometimes called harvest-aids) and desiccants.

  • Pre-harvest herbicides are non-selective systemic herbicides that provide late season perennial weed control and may improve the harvestability of the crop by reducing the amount of green material in the field.
  • Desiccants are non-selective herbicides that rapidly dry down the crop and weeds to allow for an earlier harvest.

Comparison between pre harvest herbicide and desiccant characteristics Sask Flax

Figure 2: Comparison between preharvest herbicide and desiccant characteristics. Credit: SaskFlax

Can we use glyphosate as a preharvest aid?

Since it does terminate the crop, preharvest glyphosate may assist with stem dry-down and harvestability, however it is expected that the effects of glyphosate applied alone on flax dry-down can be slow and potentially inconsistent depending on environmental conditions. This all being said, at this time, it is not a recommendation of Manitoba Crop Alliance to apply glyphosate as a preharvest aid due to inconsistent results with maximum residue limit (MRL) testing. If a producer must use glyphosate, it is strongly recommended to speak with their grain buyer to determine if a glyphosate application to their flax will be a marketing concern.

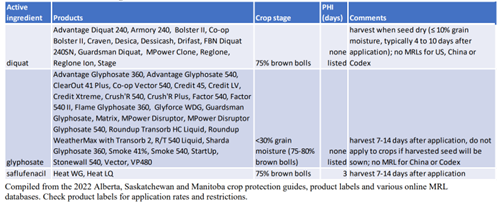
What are the current registered preharvest aids and desiccants for flax in Manitoba?

Preharvest chemicals registered for use on flax Sask Flax

Figure 3: Preharvest chemicals registered for use on flax. Credit: SaskFlax

References:

SaskFlax: Preparing for Harvest, July 2018. https://www.saskflax.com/quadrant/media/Pdfs/Flax%20on%20the%20Farm/180724_July_Flax_on_the_Farm_Final.pdf

Indian Head Agricultural Research Foundation: Pre-harvest Weed Control and Desiccation Options for Flax, 2019. https://iharf.ca/wp-content/uploads/2021/04/Pre-harvest-weed-control-and-desiccation-options-for-flax.pdf

SaskFlax: Flax Markets and Maximum Residue Limits, April 2022. https://www.saskflax.com/quadrant/media/Pdfs/Flax%20on%20the%20Farm/2022/220425%20MRL%20Information-April.pdf

Article written by Morgan Cott, Agronomy Extension Specialist – Special Crops with Manitoba Crop Alliance

Head Rot Identification in Sunflowers & Harvest Management

Rhizopus Head Rot

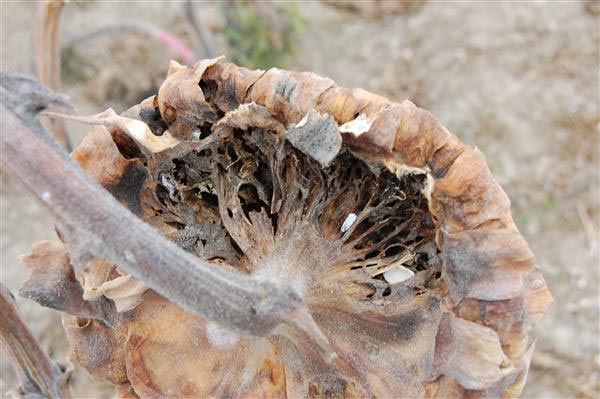
Rhizopus rarely occurs in Manitoba and is more of a southerly disease, however it is possible to see it here after severe storms and hail, followed by very high heat. Identifying factors that separate Rhizopus from other head rots are gray mycelia with very small black structures.

Rhizopus begins as a typical “water-soaked” dark spot on the back of a sunflower head that grows into a larger watery, soft rot and then dries and turns darker brown. Eventually, heads dry down, though this occurs prematurely in comparison to healthy plants, and infected tissue shreds, exposing gray threadlike strands of mycelial growth.

Key points:

  • Enters head via wound caused by hail, most commonly
  • Water-soaked lesion on backs of sunflower head
  • Gray mycelial growth inside the diseased head, which can later present itself on the face of the sunflower head
  • Tiny black spots, about the size of a pinhead
  • 100% yield loss potential due to dropped heads

Rhizopus Dry and skeletonized head Bob Harveson University of Nebraska

Figure 1: Dry and skeletonized head (Bob Harveson, University of Nebraska)

Coarse dirty white to gray threadlike fungal growth of Rhizopus spp in sunflower head Bob Harveson University of Nebraska

Figure 2: Coarse, dirty white to gray, threadlike fungal growth of Rhizopus spp. in sunflower head (Bob Harveson, University of Nebraska)

Sclerotinia Head Rot

Sclerotinia is very common in Manitoba and in several grain crops, which makes crop rotation the best management practice for this prevalent disease. A recommendation for sunflowers is to only include it in rotation when other sclerotinia host crops have not been grown on that field for 4-7 years. Chemical control is used frequently, however due to the small window for application, coverage is difficult to rely on.

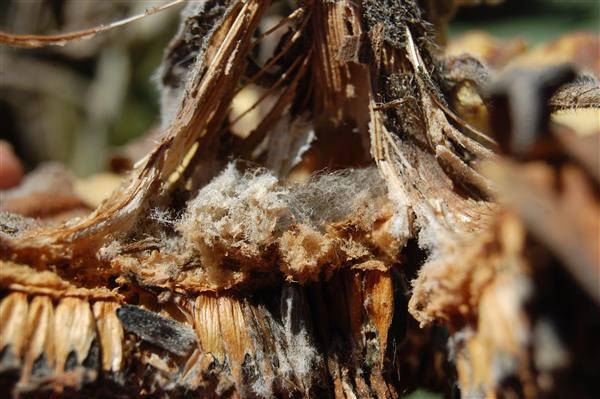
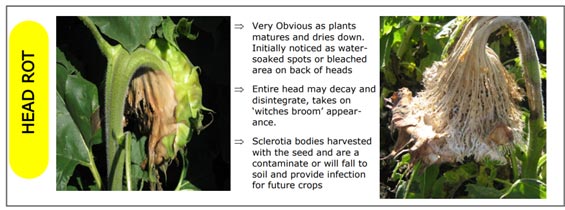
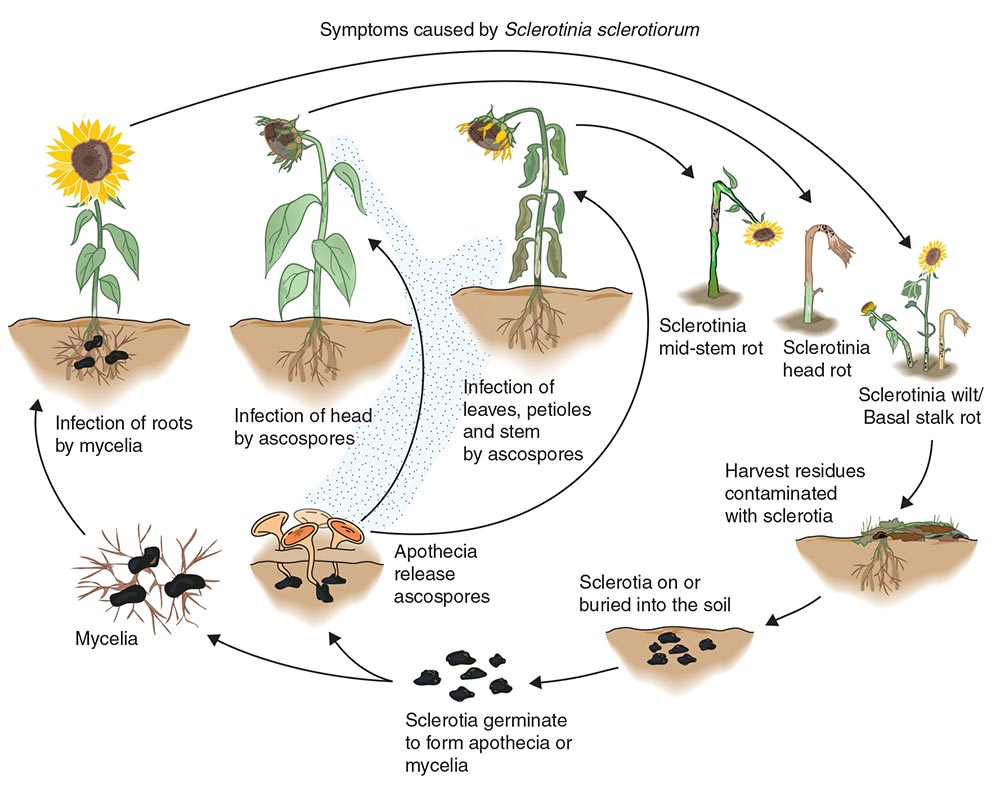
Sclerotinia presence can first be found in the field by identifying cup-shaped apothecia growing on the soil surface, which produce ascospores. Symptoms in the field include the typical tan-coloured lesions on the back of sunflower heads that may be soft to the touch. As the infection spreads, the head becomes pliable and easily torn open to reveal black sclerotia bodies amongst white mycelia. Fronts of sunflower heads may have white mycelial growth, or mould, visible between the seeds. Eventually, heads will likely shred and disintegrate leaving frayed vascular elements that appear broom-like.

Key points:

  • Cup-shaped apothecia on the soil
  • Water-soaked lesions on backs of sunflower head
  • Black sclerotia bodies inside sunflower head following disease progression
  • White mycelial growth between and on seeds
  • Shredding sunflower head, resembling a straw broom

DSC 0284 01

Figure 3: Sclerotinia Head Rot on Sunflower

Sclero crop1

Figure 4: Sclerotinia Head Rot Symptoms in Sunflower

Sclerotinia Sunflower Disease Cycle v1 American Phytopathology Society

Figure 5: Sclerotinia Disease Cycle, American Phytopathological Society

HARVEST MANAGEMENT IN DISEASED SUNFLOWERS

Yield loss from sclerotinia head rot in sunflowers is a result of empty seeds, rather than poor quality. In fact, it is not uncommon to find large sclerotia bodies being harvested along with seed and degrading quality in that manner.

Due to the overall degradation of disease plants, not just from sclerotinia, it is a good practice to harvest infected fields first. The diseased areas should dry down more rapidly than healthy plants and standability isn’t reliable, whether that is a result of a stalk rot or head rot. The physical breaking of stalks or dropping of heads leads directly to yield loss due to the inability to pick up the grain with a header.

Article written by Morgan Cott, Agronomy Extension Specialist – Special Crops with Manitoba Crop Alliance

Late Season Planting

The reality of seeding or planting any crop into June is that yield penalties will occur. This could be due to reduced bushel weight, small seed size, and low quality grain as a result of early fall frost or poor environmental conditions leading up to maturity.

Planting corn or sunflowers beyond May 30th is still a possibility in 2022, but hybrid selection is of utmost importance, since we have already missed out on 250 crop heat units or more, depending on location. Sunflowers require 115 – 130 days to mature in Manitoba, with the varieties we currently have available. So, a sunflower crop that is planted on June 1st, will mature by September 24th, at the earliest.

Sunflowers are a great option in a wet year, if you can get them planted. They are one of the top water-users that we grow in Manitoba, only behind corn and roughly tied with soybeans. They are very well adapted to dry growing seasons as well because they will search much further for water sources than other crops.

The following tables are taken directly from a NDSU Extension article, “Replanting or Late Planting Crops”: https://www.ndsu.edu/agriculture/ag-hub/publications/replanting-or-late-planting-crops. Note that the majority of North Dakota accumulates several more crop heat units than Manitoba, even at our most southern locations, but these tables do depict a good indication of what a farmer is looking at for yield loss when planting into June.

Expected Yield Reductions when planting late NDSU

Field crop replanting suggestions ND 1

Field crop replanting suggestions ND 2

The data provided here is very cautious and simply states that anything grown after May has very little chance of being economical, which isn’t completely true, but it does encourage the fact that a farmer does have to be wary of what is being seeded after that point. The risks involved are obvious and great care must be taken in order to get any late seeded or planted crop to germinate as quickly as possible and off to a healthy start. It is not unheard of to have a crop emerge within just a few short days of planting when soils are warm and have good moisture, and the quicker that crop gets growing, the more water it will start using. Take great care in placing seed accurately in the soil, control weeds and fertilize accordingly to mitigate any early season stresses.

Corn Ear Drop

Drought conditions affect a corn crop in many different ways throughout the growing season. Silking and pollination stages are very sensitive to hot, dry conditions. Not only does the lack of rain and extreme temperature cause silks to dry up, poor pollination, and aborted kernels, but these conditions can also interfere with ear shank development.

In drought stress situations, the grain will “steal” carbohydrates from the rest of the plant, including the ear shank, in order to fill and improve quality. As result, the ear shank may become weak and eventually be unable to hang onto the ear as it becomes heavier. Another possible culprit for weakened ear shanks is in a year with rapid drydown in late summer. The cells that connect the ear shank to the ear dry too quickly and become brittle and unable to hold that ear tightly anymore. A disturbance to the corn plant, eg. a silager or combine header, can shake the ear from the plant which results in a complete yield loss for that plant.

Stalk diseases are not common in a drought year, however they are still possible. Stalk rots, such as Fusarium, will weaken the corn stalk and also the ear shank, potentially causing ear drop. Insects like European corn borer will also burrow throughout a corn plant, like in the stalk, ear shank and even the ear, which will weaken those areas of the plant.

This is generally not an issue related to genetics and it would be extremely rare to have a hybrid registered that showed such a glaring default. Ear drop won’t be something that occurs in every field, even if conditions were the same all season long. This will be an effect of planting date, conditions at planting, silking date of the given field and other agronomic factors. In other words, not preventable and simply, bad luck.

To mitigate some yield loss at harvest, combine (or silage) affected fields before any others. When harvesting grain corn, raise header just below cob height and reduce both ground and header speed. When silaging corn, it would be ideal to also raise the header, though that is not going to be popular advice to give a grower. Instead, slow ground speed to the point that you see greatest ear retention.

If there was evidence of stalk rots or insect damage, consider using hybrids with appropriate traits in the future.

60449

Several dropped ears in silage field. Photo credit: Madison Leonard, Clearview Consumers Co-op Ltd., Steinbach, Manitoba.

Article written by Morgan Cott, Agronomy Extension Specialist – Special Crops with Manitoba Crop Alliance.

Estimating Yield and Physiological Maturity

Producers and agronomists should be assessing each grain corn field now for yield estimates. Pollination is long since complete and we have an excellent idea of how many kernels have been pollinated.

The following is taken from Dr. R.L. (Bob) Nielsen on estimating corn grain yield prior to harvest. Dr. Nielsen has some excellent articles on corn production that are worth looking into. (www.agry.purdue.edu/ext/corn/news/timeless/YldEstMethod.html)

  1. At each estimation site, measure off a length of a single row equal to 1/1000th acre. For 30-inch (2.5 feet) rows, this equals 17.4 linear feet.
    TIP: For other row spacings, divide 43,560 by the row spacing (in feet) and then divide that result by 1000 (e.g., [43,560 / 2.5] / 1000 = 17.4 ft).

Corn maturity 04

Figure 1. Row length required to measure 1/1000th acre in various row widths – Ontario Grain Farmer (ontariograinfarmer.ca/2017/06/01/cropside-corn-stand-checkup/)

  1. Count and record the number of ears on the plants in the 1/1000th acre of row that you deem to be harvestable.
    TIP: Do not count dropped ears or those on severely lodged plants unless you are confident that the combine header will be able to retrieve them.
  2. For every 5th ear in the sample row, record the number of complete kernel rows per ear and average number of kernels per row. Then multiply each ear’s row number by its number of kernels per row to calculate the total number of kernels for each ear.
    TIPS: Do not sample nubbins or obviously odd ears, unless they fairly represent the sample area. If row number changes from butt to tip (e.g., pinched ears due to stress), estimate an average row number for the ear. Don’t count the extreme butt or tip kernels, but rather begin and end where you perceive there are complete “rings” of kernels around the cob. Do not count aborted kernels. If kernel numbers per row are uneven among the rows of an ear, estimate an average value for kernel number per row.
  3. Calculate the average number of kernels per ear by summing the values for all the sampled ears and dividing by the number of ears.
    EXAMPLE: For five sample ears with 480, 500, 450, 600, and 525 kernels per ear, the average number of kernels per ear would equal:
    (480 + 500 + 450 + 600 + 525) divided by 5 = 511
  4. Estimate the yield for each site by multiplying the ear number (Step 2) by the average number of kernels per ear (Step 4) and then dividing that result by a kernel weight “fudge factor”. Unless your seed company can provide some insight into kernel weight values for their hybrids, I suggest simply performing separate calculations using “fudge factor” kernel weight values equal to 75, 85, and 95. This range of values probably represents that most commonly experienced in the central Corn Belt.

Corn maturity 05

Figure 2. Grain corn yield estimate formula – Iowa State University (crops.extension.iastate.edu/cropnews/2017/08/estimating-corn-yields-using-yield-components)

Example: Let’s say you counted 30 harvestable ears at the first thousandth-acre sampling site. Let’s also assume that the average number of kernels per ear, based on sampling every 5th ear in the sampling row, was 511. Using “fudge factor” values of 75, 85, and 95; the estimated range in yield for that sampled site would (30 x 511) divided by 75 = 204, or divided by 85 = 180, or divided by 95 = 161 bushels per acre.

Repeat the procedure throughout field as many times as you deem representative. Tally and average the results separately for each “fudge factor” used for the calculations.

Remember that this year we have very uneven uniformity in most corn fields, which will influence the accuracy of any yield estimation technique. The less uniform the field, the greater the number of samples that should be taken to estimate yield for the field.

Corn maturity 03

Figure 3: Measurements for each reproductive stage of corn development and how a killing frost would affect yield at that stage.

In early September, we tend to estimate when the corn will reach physiological maturity even more than we estimate yield in each field. In recent years, Manitoba has been getting early to mid-September killing frosts, so the chart above has been a very well-used reference. If you need help determining stage of corn, visit Grain Fill Stages in Corn (Purdue University), or a simple Google search for countless resources on how to properly identify milk line or physiological maturity (black layer).

Article written by Morgan Cott, Agronomy Extension Specialist (Special Crops) with Manitoba Crop Alliance

Effects of Drought Stress on Corn

In recent years, we have dealt with drought stress in corn a lot. Most frequently, it has been overcome by timely rains and not had an impact province-wide. 2021 doesn’t appear to be letting up on the crop completely and reproductive stages of corn are just around the corner. Some sheltered areas along tree rows and yards are even beginning to tassel.

So, what happens to the plant when there isn’t enough moisture? Most visibly, corn leaves begin to curl and make the plant resemble pineapple leaves or onion greens. This occurs because the leaves are protecting themselves from excessive moisture loss or transpiration. Believe it or not, the more readily a plant curls its leaves up, the more beneficial it is to that plant. This year it is hard to determine with absolute positivity whether those plants are protecting themselves, or really in dire straits for moisture availability. There is no question, though; leaf rolling is a response to moisture deficits and it is widespread. This transpiration increases as leaf area increases and it is the mechanism that water moves from the soil, through the plant and into the atmosphere. If leaf rolling is resulting from true drought stress and occurs for 12+ hours a day, grain yield is likely to decrease, even prior to reproductive staging.

Right now, mid-July 2021, the crop is at a detrimental stage for water requirements. The corn is a little behind “normal” as a result of the lack of moisture and high heat combination, so on a regular year the corn would likely be at tassel (VT) or silking (R1) stages. “Potential ear size is already determined by the time silks emerge from the ear shoots. In fact, potential kernel row number is set by the 12-leaf collar stage (about chest-high corn.) Potential kernel number per row is determined over a longer time period, from about the 12-leaf collar stage to about 1 week prior to silk emergence” (https://www.agry.purdue.edu/ext/corn/pubs/corn-07.htm).

We know that row number is heavily predetermined through genetics, but kernels per row is not and has a strong sensitivity to environmental stresses. Below is a table identifying the potential yield reduction from drought stresses (with 4 consecutive days of leaf wilting) throughout the growing season.

Corn July 14 21 table crop

Severe drought stress has the greatest impact during silk elongation, which often results in poor pollination. Silks on the base of the ear begin to elongate first, followed by those from the center and then the tip of the ear. So, when plant water is in low supply, the silks elongate slowly and may not even elongate beyond the husk. If the silk isn’t outside the husk during pollen shed, it will not pollinate those potential kernels. During these conditions, silks that do emerge have an increased chance of desiccating quickly, making them unable to receive pollen.

There is no gain made in worrying about what may happen over the next few weeks. What is promising is that corn has an amazing ability to recover from drought stress when it does receive rain. It is very unlikely that no pollination will occur whatsoever, but if dry conditions persist, it is likely that grain will not fill to its full potential. This is where rain events can really improve grain quality and the length of the crop’s life after it has been under severe stress.

Farming through a drought is something Manitobans haven’t had to do in decades and it is a steep learning curve. The best thing you can do is choose wisely where to put crop inputs and where not to. Producers are all under a great deal of stress this year, but we are all here to provide each other with the support we need. This year is teaching us a great deal about what crops and what fields handle a lack of moisture the best, in the same way that we learned about excess moisture tolerance in past years.

With that being said… time to go fishing??

Assessing Plant Stands

Seeding rate for sunflowers depends on sunflower type. Oil-type sunflower populations range from 20,000 – 22,000 plants per acre (0.6 plants per ft2) but confection-type sunflowers should not exceed 18,000 plants per acre (0.4 plants per ft2) to ensure large seed size.

The easiest method to measure plant stand per acre is by doing the following:

1. Determine row width and using the table below, identify the correct distance to measure 1/1,000th acre.

1 1000th acre

2. Using a measuring tape, lay out the appropriate length for 1/1,000th acre.

3. Count all plants in the length laid out. When there are doubles, consider only counting one of the plants, since only one is likely to be productive.

4. Document plants counted.

5. Repeat steps 2-4 ten times.

6. Average all plant counts to determine and approximate final plant stand.

Another simple way to assess plant stand is to use the table below, developed by Manitoba Agriculture and Resource Development:

Seed Density as a Function of Row Spacing

Plant Spacing

In years when establishing a healthy and robust sunflower crop seems impossible due to various growing conditions, it is a very difficult decision on whether to terminate or keep a crop. Above are just a couple of ways to accurately determine how many plants are viable, which will help to estimate yield potential and all the costs required to bring sunflowers to maturity.

There is no documented data on the lowest plant population a producer can grow and still make a profit. Good record keeping and market knowledge will help someone in this situation make an educated assessment on whether the crop will be profitable or not.

Growth Stage and Herbicide Application

Herbicide applications are well-underway in corn, including tank-mixes. Fields should always be scouted before any herbicide application for weeds present, precise crop staging and environmental conditions that could have an affect on efficacy.

Applying a herbicide at early growth stages provides greater crop safety, in most cases. The corn plant has a smaller surface area to be in contact with the herbicide, which means a smaller risk of damage. Herbicides with active ingredients like 2,4-D or dicamba can need to be applied to the crop as early as possible for this reason: the larger the crop, the greater the plant surface area and the greater the risk to the crop. It is very important to refer to all herbicide labels and contact appropriate companies with any questions prior to applications.

Refer to Manitoba Crop Alliance’s Vegetative Growth Stage ID factsheet for staging tips.

Also available is a Quick Herbicide Reference Guide for current pre-emergent and post-emergent herbicides on the market in Manitoba.

Quick Herb Ref Guide

Post-emergent herbicide application tips: (for full list, visit https://www.dekalbasgrowdeltap…)

  • ALWAYS READ AND FOLLOW LABEL DIRECTIONS.
  • Corn under stress may not have the ability to metabolize some herbicides quickly enough to avoid crop injury. Weeds under stress may not may not accept the herbicide to its full capacity.
  • Spray additives can increase the rate of herbicide uptake by the crop.
  • Herbicide residues from previous applications may remain in the spray tank causing contamination.
  • Post-emergent herbicide injury symptoms can include leaf chlorosis or necrosis, onion leafing, internode stacking, rat tailing, ear pinching, ear bottlenecking, brace root malformation, and green snap.

Reference: https://www.dekalbasgrowdeltap…

Flax: Emergence and Frost

Frost Impact on Flax

Flax plants just emerging (cotyledon stage) are the most susceptible to early spring frost, but can withstand temperatures down to approximately -3° Celsius. After the seedlings have passed the two leaf stage and are hardened by exposure, they can withstand temperatures as low as -8°C for a short time, without significant damage (https://flaxcouncil.ca/growing…).

Flax is generally at the first whorl stage right now, so a hard frost can have significant damage on the crop. It is important to follow the typical frost scouting techniques and wait 3-5 days to see whether frost has impacted the crop or not.

Emergence Monitoring (posted by SaskFlax: https://www.saskflax.com/quadr…)

One way to work towards optimizing flax performance on your farm is to determine the plant population and calculate emergence rate. Relating these numbers back to the seeding rate used, the environmental conditions and other factors at seeding can help determine management practices for the growing season and adjustments that can be made next year.

Steps to determine actual plant population and emergence rate:

1. At 1.5 to 2 weeks after seeding, count the number of plants per square metre or foot in a few representative locations in the field and calculate the average. This number is the plant population. To maximize yield potential, the minimum desired population for flax is 300 plants/m2 (28 plants/ft2) and the maximum is 400 plants/m2 (37 plants/ft2).

READ MORE at SaskFlax’s May 2021 edition of Flax on the Farm

Top